Get the latest Market Report for April 21, 2025, featuring key insights, analysis, and trading opportunities across major markets.

Market Report – 21st of April, 2025

EUR/USD
🔹 Overall Sentiment:
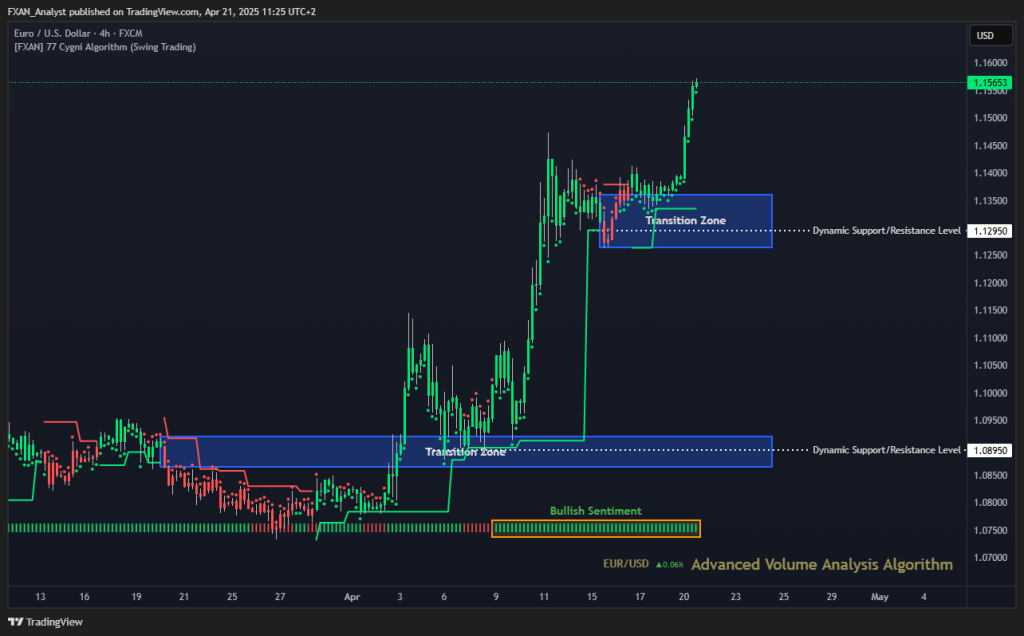
Bullish – EUR/USD is currently trading at 1.15653, maintaining strong bullish momentum for over a week and a half. The continued series of higher highs and higher lows confirms that market participants remain confident in the euro’s strength relative to the dollar. This persistent uptrend reflects improving eurozone sentiment and/or ongoing USD weakness, fueling the rally. Buyers are clearly in control, and unless there is a significant rejection from higher levels, the pair looks poised to continue climbing.
🔹 Transition Zones:
1.08650 – 1.09200 – Bearish Transition Zone.
This zone served as the launchpad for the current bullish leg. After a long period of sideways consolidation, the breakout above this zone confirmed a structural shift in market sentiment, turning it into a valid demand zone on any future pullbacks.
1.12650 – 1.13600 – Bearish Transition Zone.
Recently broken to the upside, this transition zone acted as a minor consolidation area before the most recent breakout. The price cut through it decisively, suggesting strong momentum and confirming it as a supportive region in the event of retracement.
🔹 Dynamic Support/Resistance Levels:
Price: 1.08950
This level marks the former range low, now acting as a critical support structure. It’s well beneath current price but still serves as an important longer-term floor for trend validation.
Price: 1.12950
Now confirmed as a flipped support after being broken cleanly. The price held above this level during a brief consolidation phase, which may reinforce this level as a strong base moving forward.
🔹 Commentary:
EUR/USD continues its unstoppable march higher, recently clearing the 1.13–1.14 resistance cluster with conviction. Bullish sentiment remains robust, supported by a healthy volume profile and aggressive upward structure. As long as the pair remains above the 1.12950 zone, bulls are firmly in control. Any minor pullbacks into the recent breakout zone may attract renewed buying interest, with upside targets now shifting toward psychological milestones such as 1.16000 and beyond.
GBP/USD
🔹 Overall Sentiment:
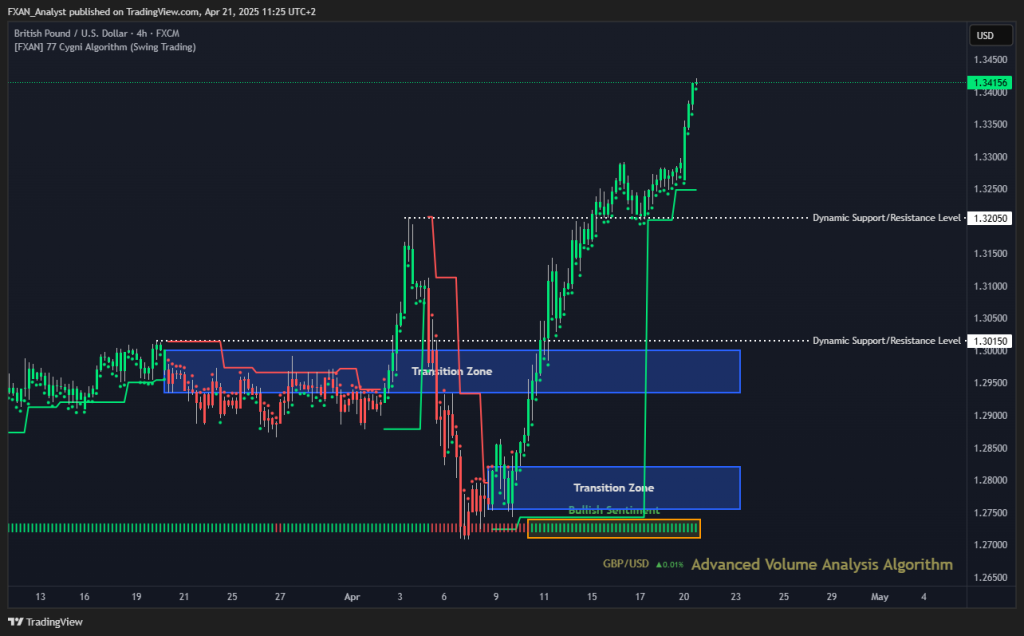
Bullish – GBP/USD is trading at 1.34156, continuing its powerful rally that has persisted for over a week and a half. The pair has been carving out a clean bullish structure with aggressive momentum, indicating strong institutional support behind the breakout. The strength of this trend showcases a clear divergence between the British pound and the U.S. dollar, with the pound enjoying favorable sentiment across sessions. Momentum remains firmly in buyers’ hands, and the uptrend shows no signs of exhaustion just yet.
🔹 Transition Zones:
1.27550 – 1.28200 – Bullish Transition Zone.
This lower zone acted as the final area of accumulation before the explosive bullish breakout. Once price cleared this range, it marked the beginning of the new uptrend and is now a key structural support zone.
1.29350 – 1.30000 – Bearish Transition Zone.
A former resistance zone that was broken with conviction. Price hovered around it briefly before launching higher, making it a notable area for potential re-tests or short-term consolidation if momentum stalls.
🔹 Dynamic Support/Resistance Levels:
Price: 1.30150
This level represents a significant structural pivot. It aligned closely with the upper end of the second transition zone and is now expected to serve as a key support level going forward.
Price: 1.32050
Recently broken, this dynamic level now acts as immediate support. The market tested and cleared this level decisively, suggesting bullish continuation remains likely as long as it holds.
🔹 Commentary:
GBP/USD has delivered a textbook bullish breakout, with momentum accelerating after reclaiming the 1.30000 level. Volume remains supportive, and the algorithmic sentiment confirms sustained bullish pressure. With price well above all major support structures and trading in open air, bulls may begin eyeing higher psychological targets like 1.35000. Any brief dips into the 1.32050–1.33000 zone could offer favorable long setups for continuation plays.
GOLD (XAU/USD)
🔹 Overall Sentiment:
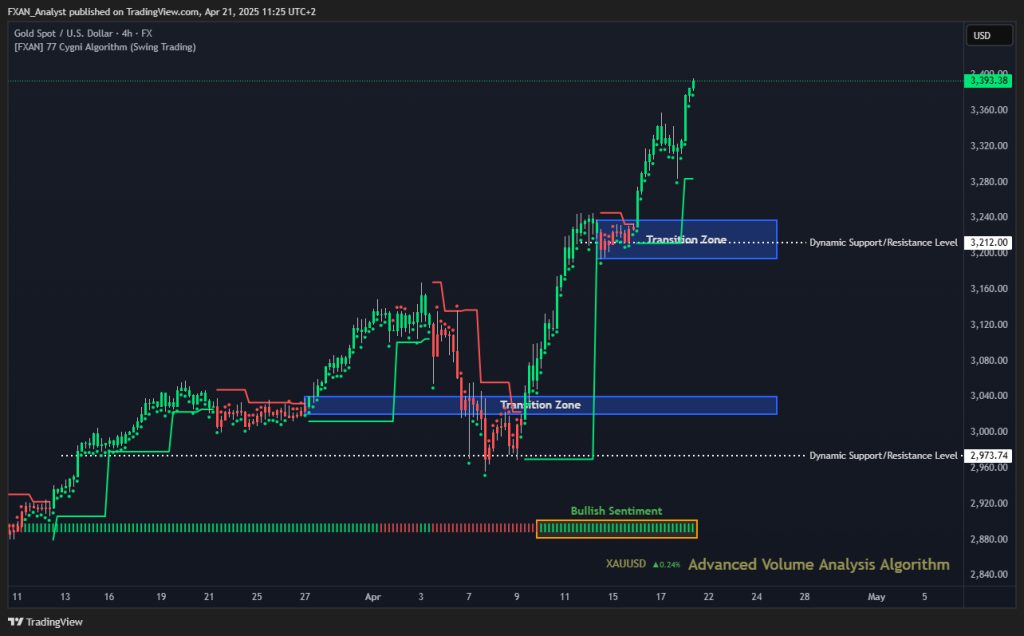
Bullish – Gold (XAU/USD) is trading at 3393, continuing its powerful rally with a firm bullish sentiment extending through the past week. The pair has maintained an impressive trajectory of higher highs and higher lows, with buyers aggressively controlling momentum. Gold’s breakout reflects global demand for safe-haven assets amidst broader economic uncertainty. The technical structure remains intact, and volume support suggests that institutional activity is contributing to this surge.
🔹 Transition Zones:
3020 – 3040 – Bullish Transition Zone.
This earlier transition zone served as a pivotal launchpad for the current uptrend. After price consolidated in this region, bulls firmly took control, using it as the base for upward expansion.
3194 – 3237 – Bearish Transition Zone.
This more recent zone was a temporary stalling point where price briefly paused before its next leg higher. Its breakout confirms that bullish control remains dominant, and the zone now acts as a support buffer should price retrace.
🔹 Dynamic Support/Resistance Levels:
Price: 2975
This deeper level marks the origin of the broader bullish trend. As long as the market stays above this dynamic support, the long-term uptrend remains structurally sound.
Price: 3212
This is now the nearest dynamic support level and a critical one. Price broke through it decisively and has since accelerated to new highs, confirming that buyers are defending this zone strongly.
🔹 Commentary:
Gold continues to exhibit exceptional bullish strength, reaching fresh multi-week highs as buying volume intensifies. With both structural and dynamic supports well below the current price, bulls remain firmly in control. A pullback toward the 3237–3212 range could serve as a healthy retest, offering a possible re-entry opportunity for trend-following strategies. Momentum remains strong, and price is beginning to approach key psychological resistance around 3400 and 3450.
WTI (Crude Oil)
🔹 Overall Sentiment:
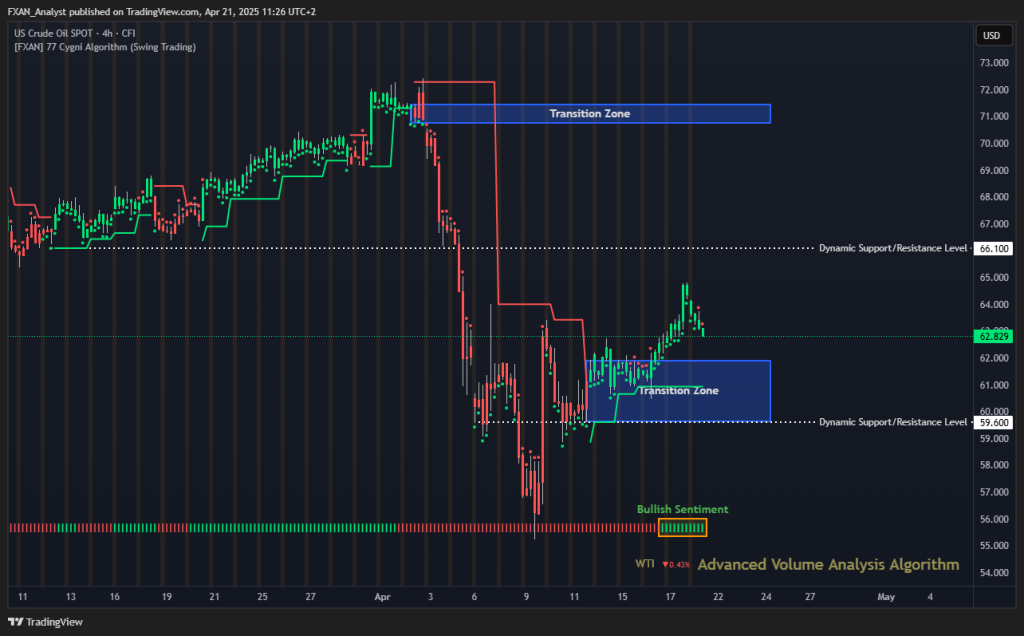
Bullish – WTI is trading at 62.829 after a gradual recovery from the recent downtrend, with bullish sentiment sustained over the past four days. While not as aggressive as the rallies seen in other markets, buyers have reclaimed short-term control and are attempting to form a solid base above the recent lows. Momentum has shifted from deep bearish territory to neutral-to-bullish, indicating potential for continuation if price remains above the lower support zones. However, this recovery still faces structural resistance ahead, so caution is advised on long entries near upper boundaries.
🔹 Transition Zones:
59.650 – 61.900 – Bullish Transition Zone.
This zone acted as a key reversal base. Price consolidated here before breaking higher, establishing it as a potential accumulation area. It now serves as a critical support region that bulls must defend on any pullbacks.
70.750 – 71.450 – Bearish Transition Zone.
Still untouched by the recent move, this upper transition zone remains a key upside target if momentum continues. Reclaiming this area would mark a significant shift in WTI’s medium-term outlook.
🔹 Dynamic Support/Resistance Levels:
Price: 59.600
This dynamic level was previously tested during the downtrend and now coincides with the lower edge of the transition zone. It is an important pivot point—if broken again, bearish control could quickly resume.
Price: 66.100
This resistance has not yet been tested since the recent recovery. It represents a structural hurdle and will be a key target for bulls if the market continues to build upward pressure.
🔹 Commentary:
WTI has managed to stabilize after heavy downside pressure earlier in the month, and recent activity shows promising signs of a shift in control. The consolidation above the 60.00 mark is constructive, but bulls need to push through the 64–66 range to confirm a broader reversal. Traders should monitor for a potential bullish continuation pattern above 63.50, while watching the 59.60 level closely for signs of weakness or failure in structure.
S&P 500
🔹 Overall Sentiment:
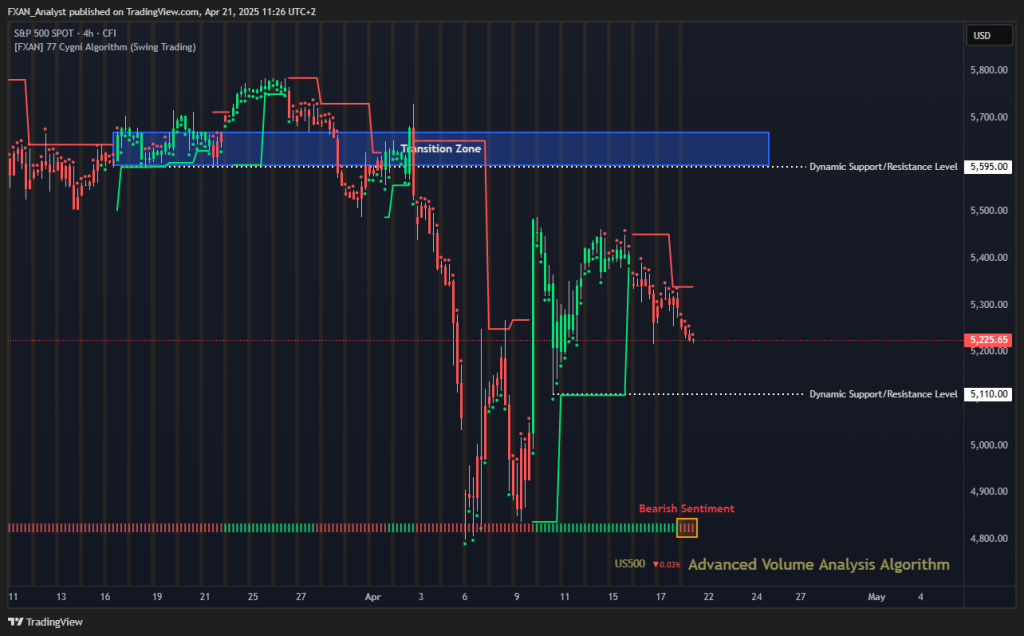
Bearish – The S&P 500 is trading at 5225.65, showing renewed bearish sentiment that has taken hold over the past day. After a brief bullish bounce, the index has failed to sustain momentum, and sellers are beginning to reclaim dominance in the short term. The market remains below a major resistance zone, and the inability to push higher suggests exhaustion in the recent bullish move. This opens the door to further downside exploration, particularly if key support levels fail to hold.
🔹 Transition Zones:
5598 – 5669 – Bullish Transition Zone.
This zone remains untested following the April decline and now represents a strong overhead barrier. It previously acted as a structural consolidation range and now serves as a potential rejection point should any bullish recovery develop.
🔹 Dynamic Support/Resistance Levels:
Price: 5110
This dynamic level has held as a foundational support through multiple testing phases. It remains the key downside pivot — a decisive break below this level could accelerate selling pressure and trigger a broader correction.
Price: 5595
This upper dynamic resistance level coincides with the lower bound of the transition zone. Price has remained firmly below it, validating the current bearish environment and highlighting the importance of this area in confirming any potential reversal.
🔹 Commentary:
The S&P 500’s failure to reclaim higher levels has shifted the tone to caution, with recent price action resembling a potential bearish continuation pattern. Sellers are gaining short-term traction, and unless bulls can reclaim the 5350–5400 region quickly, further pressure toward 5110 appears likely. Traders should be alert for a breakdown retest or a rejection from any intraday rallies into resistance, as momentum indicators begin to tilt back in favor of the bears.
BTC/USD (Bitcoin)
🔹 Overall Sentiment:
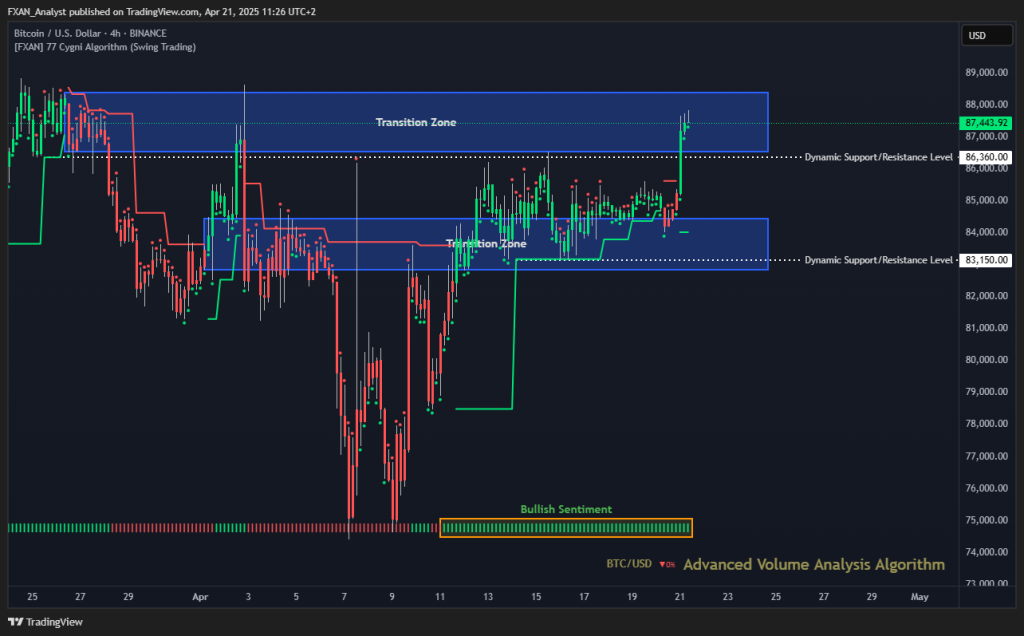
Bullish – Bitcoin is currently trading at 87,443, continuing its strong rally with bullish sentiment in place for over a week. Price has just broken into the upper transition zone with conviction, signaling renewed interest and a possible extension of the current leg up. The breakout has been supported by persistent volume activity and structural follow-through. With price now comfortably above former resistance, bulls remain in control and appear poised to challenge the upper bounds of the transition range.
🔹 Transition Zones:
82,850 – 84,450 – Bullish Transition Zone.
This zone acted as the launchpad for the latest breakout. After multiple rejections and sideways consolidation in this area, BTC/USD finally broke above it with significant momentum, confirming it as a solid support region moving forward.
86,530 – 88,375 – Bearish Transition Zone.
Now in play, this upper transition zone represents the final resistance band before price enters uncharted territory. A decisive move through this zone could trigger additional upside as breakout traders and momentum buyers re-enter the market.
🔹 Dynamic Support/Resistance Levels:
Price: 83150
Previously acting as resistance, this level now serves as a key support aligned with the lower edge of the prior transition zone. If price revisits this level, bulls will likely defend it aggressively as part of a potential retest setup.
Price: 86360
This level coincides with the lower part of the current transition zone. BTC has pushed past it decisively, confirming short-term trend strength. As long as price remains above this line, bullish momentum is favored.
🔹 Commentary:
BTC/USD has shifted from consolidation to expansion, breaking out after a lengthy range between 83K and 85K. This breakout has been accompanied by strong bullish sentiment, as highlighted by the consistent green volume bias below. If price holds above the 86K mark and continues through the upper transition zone, a push toward 89K+ becomes increasingly likely. However, any retest of the 84K–85K zone should be monitored closely for signs of strength or failure to sustain the rally.