Get the latest Market Report for December 10, 2025, featuring key insights, analysis, and trading opportunities across major markets.

Market Report – 10th of December, 2025

EUR/USD
🔹 Overall Sentiment:
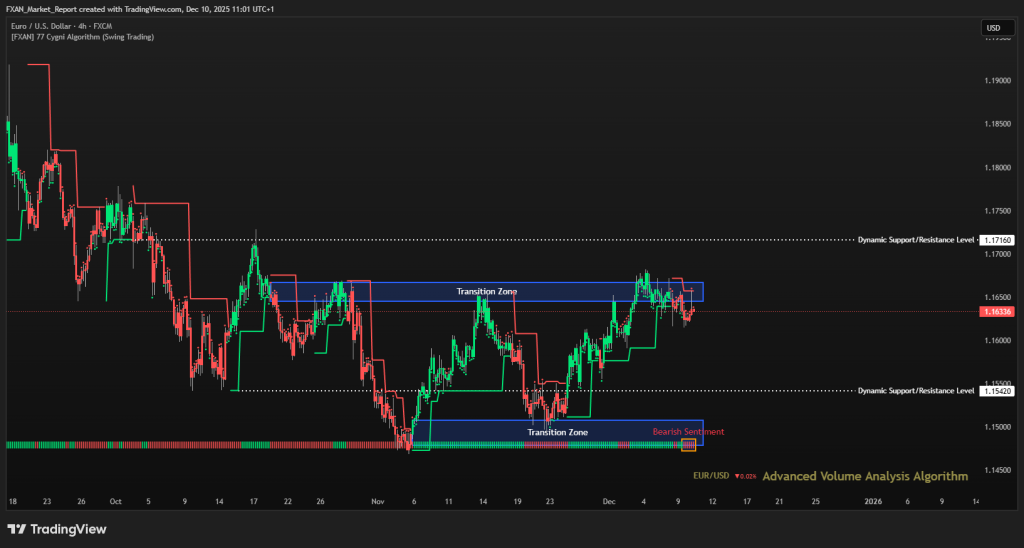
Bearish – EUR/USD shows a shift toward bearish sentiment over the last day, with price pulling back after failing to sustain momentum above the upper transition zone. This indicates weakening bullish pressure and a possible short-term corrective phase. Despite the broader upward structure seen in previous days, the current sentiment suggests sellers are gaining influence. Traders should watch for continuation signals confirming whether this pullback deepens or stabilizes.
🔹 Transition Zones:
1.16450–1.1667 – Bearish Transition Zone.
Price briefly approached this upper zone but was rejected, reinforcing its importance as a short-term resistance band. Continued failures to break and hold above this zone may invite further selling pressure in the coming sessions.
1.14790 – 1.15080 – Bullish Transition Zone.
This lower zone acts as a structural support area that has held multiple times in recent weeks. Should bearish momentum strengthen, this zone becomes the primary downside target where buyers may attempt to reassert control.
🔹 Dynamic Support/Resistance Levels:
Price: 1.17160
This dynamic level remains an overhead resistance that price has struggled to reach, indicating it is unlikely to be tested without a shift in current momentum. A move back toward this level would require renewed bullish strength and improving sentiment.
Price: 1.15420
This level now serves as the nearest dynamic support and could be tested if bearish sentiment continues to build. A clean break below it would signal increasing downside risk and open the path toward the lower transition zone.
🔹 Commentary:
EUR/USD is showing early signs of exhaustion after a multi-day rally, with the latest bearish sentiment suggesting a potential short-term reversal. Volume-based signals indicate softness in buying pressure, giving sellers an opportunity to step in. Key support levels below will determine whether this is only a temporary pullback or the start of a broader correction. Traders should remain attentive to intraday volatility around the transition zones, as these areas will likely dictate the next directional move.
GBP/USD

🔹 Overall Sentiment:
Bullish – GBP/USD continues to hold a bullish sentiment for the last eleven days, although momentum has slowed after reaching the upper transition zone. Price is consolidating just below resistance, signalling a potential pause before the next directional move. The structure remains constructive as long as price holds above dynamic support, but buyers need renewed strength to break higher. Market participants should monitor whether this consolidation evolves into continuation or early distribution.
🔹 Transition Zones:
1.33330–1.33660 – Bullish Transition Zone.
This zone continues to act as a strong resistance band, with price repeatedly struggling to secure a sustained move above it. A clean breakout and close beyond this area would confirm bullish extension and open the path toward higher targets.
1.30390–1.30650 – Bullish Transition Zone.
This lower zone remains a firm support region where bullish sentiment initially strengthened. If price retraces, this area could provide a significant reaction point for buyers to re-engage.
🔹 Dynamic Support/Resistance Levels:
Price: 1.32480
Price is currently hovering just above this dynamic support level, which is acting as the nearest structural floor for bullish continuation. Losing this level could weaken the short-term bullish narrative and shift focus toward deeper corrective zones.
Price: 1.30820
This secondary dynamic support level represents a stronger structural base for the ongoing trend. Should the market decline, a retest of this level would determine whether the broader bullish sentiment can remain intact.
🔹 Commentary:
GBP/USD remains in a steady upward structure, yet the inability to firmly break the upper transition zone highlights the rising presence of short-term selling pressure. The pair may continue to range between dynamic support and the overhead transition zone while awaiting fresh catalysts. Volume patterns indicate consolidation rather than reversal, suggesting accumulation may still be in play. Traders should watch for breakout confirmation from the upper zone or a potential pullback into support to gauge the next move.
GOLD (XAU/USD)
🔹 Overall Sentiment:
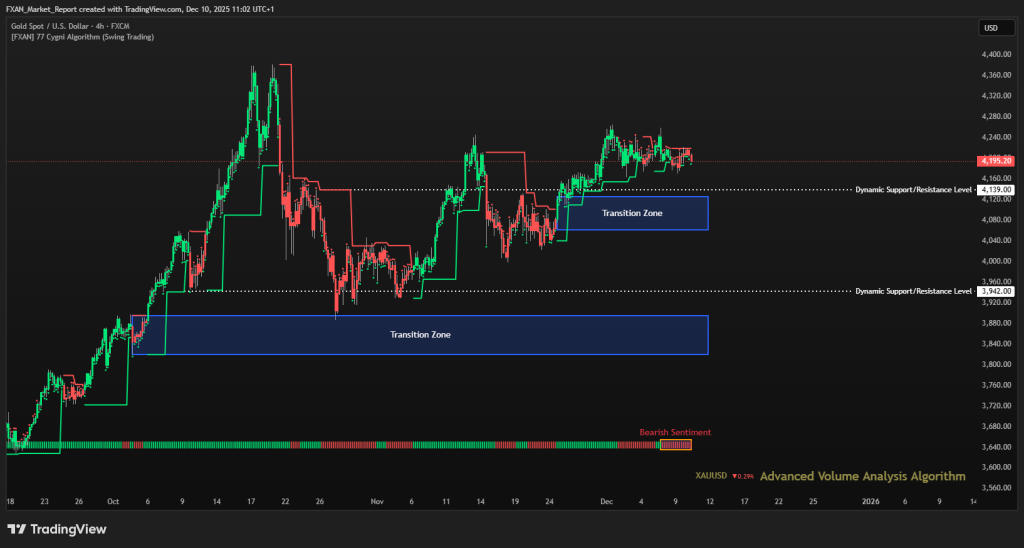
Bearish – XAU/USD has maintained bearish sentiment for the last four days, with price struggling to gain momentum above the current short-term range. Sellers remain in control as long as the market holds below key resistance, and the recent flattening of structure suggests weakening bullish attempts. Despite minor intraday recoveries, the broader flow still points toward downside pressure. A decisive break beneath support levels would further validate the bearish continuation outlook.
🔹 Transition Zones:
3820–3895 – Bearish Transition Zone.
This zone represents a major downside liquidity pocket where price previously accumulated before moving higher. If bearish momentum strengthens, this area may become a key target for sellers seeking deeper retracements.
4061–4125 – Bullish Transition Zone.
Price is currently hovering near this upper transition zone, which continues to cap bullish attempts. A sustained break above this region would be required to shift sentiment away from short-term bearishness.
🔹 Dynamic Support/Resistance Levels:
Price: 3942
This level remains the next significant dynamic support area, and a break below it would open the way for stronger downside continuation. Buyers may attempt to defend this level, but weakening momentum suggests their efforts could be limited.
Price: 4139
This dynamic resistance level has repeatedly rejected bullish attempts, reinforcing the prevailing bearish structure. Until price convincingly closes above this zone, the overall outlook remains pressured to the downside.
🔹 Commentary:
Gold is currently displaying a slow, controlled decline, with sellers gradually reclaiming dominance after the recent consolidation phase. Volume behavior suggests a lack of strong buying interest, which aligns with the ongoing bearish sentiment. Traders should closely monitor whether price can break below the dynamic support at 3942, which would confirm a deeper correction. Conversely, a break above 4139 would be the first meaningful sign of sentiment shifting back in favor of buyers.
WTI (Crude Oil)
🔹 Overall Sentiment:
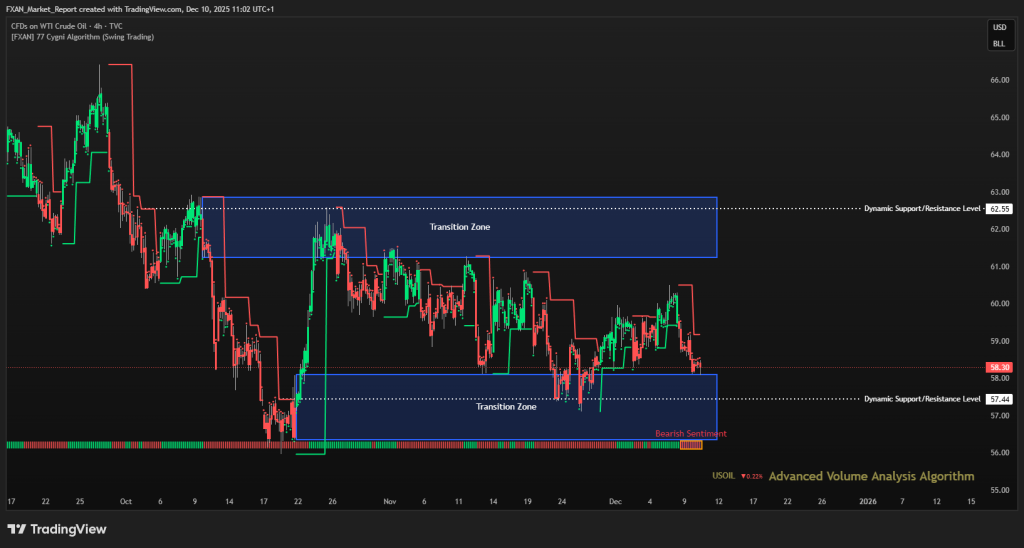
Bearish – WTI has shifted into a bearish sentiment over the last two days, with price steadily declining toward lower support regions. Selling pressure has intensified, and the recent breakdown from short-term structures suggests a continuation of downside momentum. Bulls have failed to defend key intraday levels, allowing bears to regain control of market direction. As long as price remains below major resistance, sentiment is expected to stay bearish in the near term.
🔹 Transition Zones:
61.25–62.85 – Bearish Transition Zone.
This upper transition zone marks a strong supply region where previous rallies were consistently rejected. If price attempts a recovery, this zone will act as a major barrier that sellers are likely to defend aggressively.
56.35–58.10 – Bullish Transition Zone.
WTI is currently hovering near this lower transition zone, which represents a key decision area between continuation and stabilization. A breakdown below this zone would strengthen the bearish outlook and expose deeper downside targets.
🔹 Dynamic Support/Resistance Levels:
Price: 62.55
The first dynamic resistance level aligns closely with the upper transition zone, making it a significant barrier for buyers. A breakout above this level would be a strong signal of bullish continuation and could shift market sentiment decisively upward.
Price: 57.44
This dynamic support level lies just beneath current price and will be a critical point to monitor. A clean break below this zone may trigger stronger seller participation and accelerate downside movement.
🔹 Commentary:
WTI continues to show weakening momentum, with sellers dominating short-term order flow. The repeated rejections at higher levels and the progression toward lower supports signal a market leaning toward further decline. Traders will be watching the 57.44 level closely, as a breach could open the path for a deeper selloff into the mid-56 range. Until buyers demonstrate sustained strength above resistance, bearish sentiment remains firmly intact.
S&P 500
🔹 Overall Sentiment:
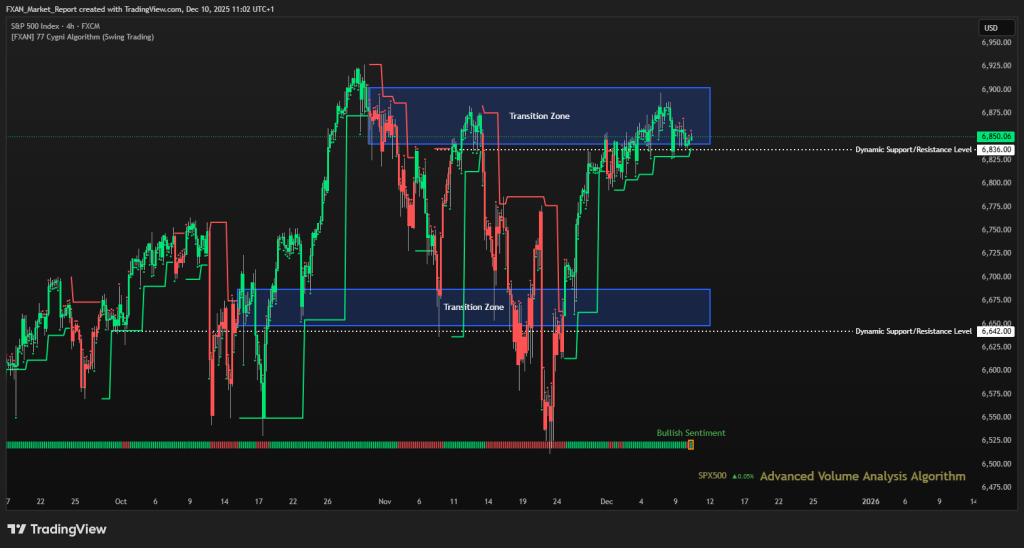
Bullsih – The S&P 500 shows bullish sentiment over the past few hours as price continues to hold above the key dynamic support level, reflecting sustained buyer interest. Momentum remains constructive, and the market is attempting to stabilize within the upper boundary of its recent range. While short-term volatility persists inside the transition zone, buyers maintain control as long as price remains above the key supports. A breakout above the upper transition zone could reinforce the bullish structure further.
🔹 Transition Zones:
6648–6687 – Bullish Transition Zone.
This zone represents a strong historical accumulation region where buyers previously stepped in aggressively, forming a foundation for upward movements. If price revisits this zone, it is likely to act as a demand pocket, attracting renewed buying interest.
6842–6902 – Bearish Transition Zone.
Price is currently trading inside this upper transition zone, where prior reactions indicate heavier liquidity and mixed order flow. A sustained push above 6902 would signal a clean break of overhead supply, while rejection from this area may trigger short-term pullbacks.
🔹 Dynamic Support/Resistance Levels:
Price: 6642
This level continues to serve as a major structural support and marks the lower boundary of the broader bullish range. As long as price remains above this dynamic level, buyers maintain a clear tactical advantage.
Price: 6836
Price is currently hovering just above this level, showing that buyers are defending it effectively. Holding above 6836 strengthens the case for a breakout toward the higher end of the transition zone.
🔹 Commentary:
The index is positioned in a favorable area for bullish continuation, especially given the current resilience near the upper transition zone. Market sentiment is aligned with upward pressure, though traders should monitor for potential whipsaws common in high-liquidity zones. If price holds above 6836, the path toward 6902 becomes more probable. A breakout above that threshold would open the door for continuation of the broader uptrend.
BTC/USD (Bitcoin)

🔹 Overall Sentiment:
Bullish – BTC/USD continues to display strong bullish sentiment over the past ten days, holding firmly near recent highs and maintaining upward momentum. Buyers have consistently absorbed dips, showing sustained confidence in the prevailing trend. The market structure remains constructive as long as price stays above key dynamic levels. A push beyond overhead resistance could further accelerate bullish continuation.
🔹 Transition Zones:
103,200 – 105,500 – Bearish Transition Zone.
This higher transition zone marks a significant supply region where sellers previously dominated, creating notable resistance. A breakout above 105500 would confirm strong bullish momentum and open the path toward higher targets.
84,300 – 86,450 – Bullish Transition Zone.
This lower zone acted as a major accumulation area where bullish sentiment initially strengthened. If price revisits this zone, it is likely to serve as a strong demand pocket supporting renewed upward movement.
🔹 Dynamic Support/Resistance Levels:
Price: 107,450
This level represents a major resistance point that BTC must clear to enter a new bullish expansion phase. A confirmed break above it would signal that buyers have overcome one of the strongest supply barriers on the chart.
Price: 93,075
Price is currently testing the underside of this dynamic level, which now acts as immediate resistance. Reclaiming and holding above 93075 would add strength to the bullish narrative and support further upside continuation.
🔹 Commentary:
BTC/USD is positioned favorably for further upside, provided it maintains support above the 93075 level. The broader trend remains bullish, and the market continues to show healthy impulsive moves on buying activity. Traders should watch for consolidation near resistance zones as this often precedes breakout attempts. If momentum persists, BTC could retest the upper transition zone sooner rather than later.