Get the latest Market Report for December 12, 2025, featuring key insights, analysis, and trading opportunities across major markets.

Market Report – 12th of December, 2025

EUR/USD

🔹 Overall Sentiment:
Bullish – EUR/USD has shifted into a bullish stance over the past day, supported by strong upside momentum and a decisive push above recent consolidation levels. Buyers remain in control after price broke through prior resistance, confirming short term trend continuation. As long as price holds above key dynamic support, bullish structure remains intact. Momentum suggests potential for further upside extension if follow through buying persists.
🔹 Transition Zones:
1.16450–1.1667 – Bearish Transition Zone.
This transition zone previously acted as a strong resistance area where price faced repeated rejections. The clean break above this zone confirms it as a former supply area that has now turned into structural support.
1.14790 – 1.15080 – Bullish Transition Zone.
This lower transition zone represents a major accumulation region where bullish sentiment originally strengthened. A return into this area would likely attract strong buying interest and act as a deeper support base.
🔹 Dynamic Support/Resistance Levels:
Price: 1.17160
This level has now been tested and slightly exceeded, indicating a key short term pivot. Holding above 1.17160 reinforces bullish control and opens the door for continuation higher.
Price: 1.15420
This level remains a critical downside support defining the broader bullish structure. A sustained move below it would weaken bullish momentum and shift focus toward deeper consolidation.
🔹 Commentary:
EUR/USD is showing early signs of exhaustion after a multi-day rally, with the latest bearish sentiment suggesting a potential short-term reversal. Volume-based signals indicate softness in buying pressure, giving sellers an opportunity to step in. Key support levels below will determine whether this is only a temporary pullback or the start of a broader correction. Traders should remain attentive to intraday volatility around the transition zones, as these areas will likely dictate the next directional move.
GBP/USD

🔹 Overall Sentiment:
Bullish – GBP/USD has maintained a strong bullish bias over the past two weeks, supported by higher highs and higher lows across the structure. Price continues to respect bullish momentum after breaking and holding above key resistance zones. Buyers remain firmly in control as long as price stays above the main dynamic support. The current structure suggests continuation rather than exhaustion.
🔹 Transition Zones:
1.33330–1.33660 – Bullish Transition Zone.
This transition zone acted as a key resistance area before price successfully pushed higher. The breakout and acceptance above this zone confirm it as a newly established support region.
1.30390–1.30650 – Bullish Transition Zone.
This lower transition zone represents a major accumulation base where bullish momentum originally formed. Any deeper pullback into this area would likely attract strong buying interest and reinforce the broader bullish trend.
🔹 Dynamic Support/Resistance Levels:
Price: 1.32480
This level now acts as an important dynamic support that defines the short to medium term bullish structure. Sustained trading above this level keeps upside momentum intact..
Price: 1.30820
This level marks a critical structural support for the overall trend. A breakdown below it would signal a potential shift in market sentiment and trend reassessment.
🔹 Commentary:
GBP/USD is trading with clear bullish dominance after reclaiming and holding above key technical zones. Price action above the former resistance area favors continued upside pressure. Short term pullbacks are currently viewed as corrective rather than trend reversing. Overall, the market structure supports further bullish continuation while key support levels remain intact.
GOLD (XAU/USD)

🔹 Overall Sentiment:
Bullish – Gold has shifted into a bullish sentiment over the last two days, supported by strong upside momentum and consecutive higher highs. Price action remains constructive above key dynamic support, signaling that buyers are firmly in control. The recent impulsive move suggests renewed demand following the prior consolidation phase. As long as price holds above key structural levels, the bullish bias remains intact.
🔹 Transition Zones:
3820–3895 – Bearish Transition Zone.
This lower transition zone represents a major demand area where strong buying interest previously entered the market. Price reacted decisively from this zone, confirming it as a long term accumulation region. A return into this zone would likely attract dip buyers again, though it currently sits well below market price.
4061–4125 – Bullish Transition Zone.
The upper transition zone has now been successfully reclaimed and respected as support, acting as a springboard for the latest bullish expansion. Sustained acceptance above this area reinforces bullish continuation potential. Any pullback into this zone may offer support as long as bullish structure remains intact.
🔹 Dynamic Support/Resistance Levels:
Price: 3942
The 3942 level acts as a key dynamic support, aligning with prior structural reactions. As long as price remains above this level, downside pressure remains limited. A clean break below would be the first warning sign of weakening bullish momentum.
Price: 4139
The 4139 level has now transitioned into near term dynamic support, confirming bullish control above it. Holding above this level keeps upside continuation favored. A loss of this level could trigger a deeper retracement toward the lower transition zone.
🔹 Commentary:
Gold is currently trading with strong bullish momentum, supported by clean structure and sustained buying pressure. Breakout strength above previous resistance levels indicates confidence from market participants. While short term pullbacks remain possible, they appear corrective rather than trend reversing. Overall, the technical outlook remains bullish as long as price continues to hold above key dynamic support zones.
WTI (Crude Oil)

🔹 Overall Sentiment:
Bearish – WTI has maintained a bearish sentiment over the last five days, with price continuing to print lower highs and lower lows. Selling pressure remains dominant as the market trades below key resistance structures. Recent price action suggests weak demand and limited bullish follow through. As long as price remains capped below major resistance, downside risks stay elevated.
🔹 Transition Zones:
61.25–62.85 – Bearish Transition Zone.
This upper transition zone represents a strong supply area, where previous bullish attempts were rejected aggressively. Price failed to sustain acceptance within this zone, reinforcing it as a key resistance band. Any retracement into this area would likely face renewed selling pressure..
56.35–58.10 – Bullish Transition Zone.
The 57.44 level is acting as near term dynamic support, closely aligned with current price action. Repeated tests of this lThe lower transition zone is currently being tested, acting as a critical decision area for price. Temporary pauses or short lived bounces may occur here due to profit taking by sellers. A sustained break below this zone would open the door for deeper downside continuation.
🔹 Dynamic Support/Resistance Levels:
Price: 62.55
The 62.55 level remains a major dynamic resistance, aligning with previous structural highs. Price staying well below this level confirms the broader bearish bias. A reclaim of this level would be required to weaken the current bearish structure.
Price: 57.44
The 57.44 level is acting as near term dynamic support, closely aligned with current price action. Repeated tests of this level increase the risk of a breakdown. A decisive close below would likely accelerate bearish momentum.
🔹 Commentary:
WTI continues to trade under sustained bearish pressure, with sellers maintaining control of market structure. Momentum remains weak, and upside attempts have been shallow and corrective in nature. The market is approaching a critical support area that could dictate near term direction. Overall, the technical outlook favors continued downside unless price can reclaim key resistance levels.
S&P 500
🔹 Overall Sentiment:
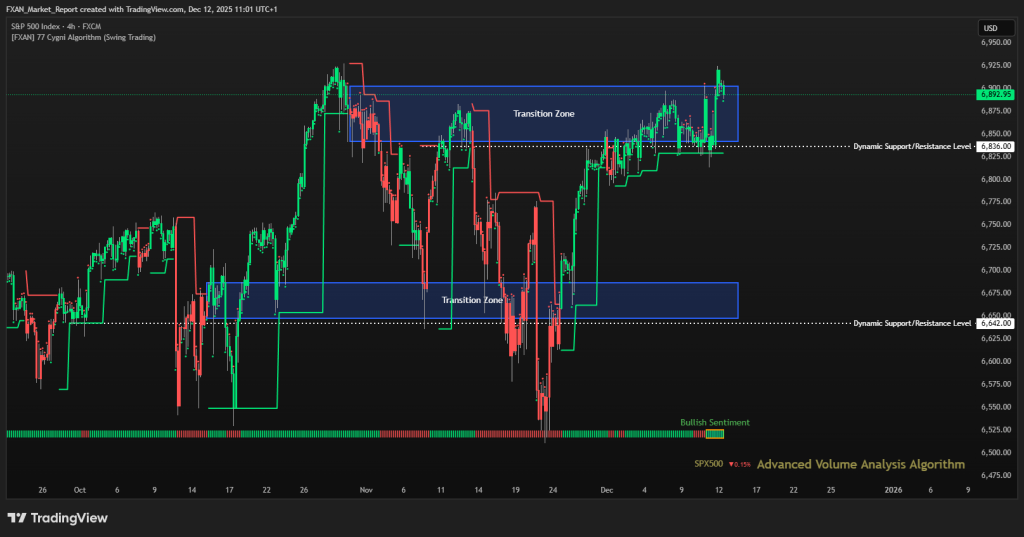
Bullsih – The S&P 500 has maintained a bullish sentiment over the last three days, supported by strong upside momentum and higher highs. Price continues to trade above key structural levels, indicating sustained buyer dominance. The recent push into higher value areas suggests confidence remains strong. As long as price holds above key support, the bullish structure stays intact.
🔹 Transition Zones:
6648–6687 – Bullish Transition Zone.
This lower transition zone represents a strong demand area, where buyers previously stepped in aggressively. Price reactions from this zone confirmed accumulation and initiated the recent upside move. A revisit of this area would likely attract renewed buying interest.
6842–6902 – Bearish Transition Zone.
The upper transition zone is currently being engaged, acting as a key area of price discovery. Short term consolidation or minor pullbacks may occur here due to profit taking. A sustained acceptance above this zone would strengthen continuation toward new highs.
🔹 Dynamic Support/Resistance Levels:
The 6642 level serves as a major dynamic support, aligning with prior structural lows. Holding above this level preserves the broader bullish bias. A break below would signal a potential shift toward corrective behavior.
Price: 6836
The 6836 level is acting as near term dynamic support, closely supporting current price action. Successful retests of this level reinforce bullish continuation. Failure to hold could trigger a short term pullback into lower value.
🔹 Commentary:
The S&P 500 remains firmly bullish, with buyers maintaining control across multiple sessions. Momentum remains strong, and pullbacks continue to be shallow and corrective. Price is consolidating near the upper transition zone, suggesting potential for further upside. Overall, the technical outlook favors continuation higher while key supports remain defended.
BTC/USD (Bitcoin)

🔹 Overall Sentiment:
Bullish – BTC/USD has maintained a bullish sentiment over the last two weeks, driven by sustained demand following the recovery from the November lows. Price continues to hold above key structural support, suggesting buyers remain in control despite recent consolidation. Momentum has slowed slightly, but the broader structure still favors upside continuation. As long as price holds above critical support, the bullish bias remains intact.
🔹 Transition Zones:
103,200 – 105,500 – Bearish Transition Zone.
This upper transition zone represents a major supply and distribution area where sellers previously regained control. Strong rejection from this zone initiated the larger corrective move lower. A future revisit would likely require strong volume expansion to achieve acceptance above it.
84,300 – 86,450 – Bullish Transition Zone.
The lower transition zone acted as a high confidence accumulation area, where buyers absorbed selling pressure. This zone marked the base of the recent bullish reversal. Holding above this region confirms it as a strong long term demand zone.
🔹 Dynamic Support/Resistance Levels:
Price: 107,450
The 107450 level remains a key dynamic resistance, capping upside attempts in the broader structure. A clean break and acceptance above this level would significantly strengthen bullish continuation. Until then, it remains a critical upside barrier.
Price: 93,075
The 93075 level is acting as near term dynamic support, closely aligned with current price action. Holding above this level keeps the short term bullish structure intact. A decisive break below could trigger a deeper retracement toward lower value areas.
🔹 Commentary:
Bitcoin is currently consolidating after a strong rebound, with price stabilizing above key support. Market structure suggests healthy digestion rather than weakness. Volatility compression near support often precedes directional expansion. Overall, the outlook remains bullish while price holds above the 93075 level.