Get the latest Market Report for December 1, 2025, featuring key insights, analysis, and trading opportunities across major markets.

Market Report – 1st of December, 2025

EUR/USD

🔹 Overall Sentiment:
Bullish – EUR/USD has maintained bullish sentiment for the last six days, signalling consistent buyer commitment and steady upward momentum. The pair continues to form higher lows, reinforcing the strength of the ongoing recovery. While bullish sentiment remains intact, price is now approaching important structural regions that may test the durability of this trend. A sustained move beyond these areas would further confirm the bullish outlook.
🔹 Transition Zones:
1.16450–1.1667 – Bearish Transition Zone.
This lower zone acts as a historical support region where buyers have repeatedly stepped in during previous declines. As long as EUR/USD remains above this zone, bullish sentiment retains a strong structural foundation.
1.14790 – 1.15080 – Bullish Transition Zone.
This dynamic level sits above current price and acts as a major resistance threshold that bulls must reclaim to sustain the trend. A decisive break and close above 1.17160 would likely accelerate bullish momentum.
🔹 Dynamic Support/Resistance Levels:
Price: 1.17160
This dynamic level sits above current price and acts as a major resistance threshold that bulls must reclaim to sustain the trend. A decisive break and close above 1.17160 would likely accelerate bullish momentum.
Price: 1.15420
This level acts as a key dynamic support area, helping maintain the current bullish structure. If price were to fall below it, the bullish sentiment would weaken and a deeper correction could follow.
🔹 Commentary:
EUR/USD continues to show strength after nearly a week of steady bullish sentiment, with buyers firmly maintaining control of short-term price action. The pair is nearing significant resistance levels, meaning volatility may increase as the market decides its next direction. Holding above dynamic support remains crucial to preserving the current upward trend. Traders should watch for reactions within Transition Zone 1, as this zone will likely determine whether the bullish move extends or pauses.
GBP/USD

🔹 Overall Sentiment:
Bullish – GBP/USD has sustained bullish sentiment for the last six days, showing steady upward pressure and consistent buying interest. The pair continues to push higher after forming a clear series of higher lows, reinforcing the strength of the current trend. Momentum remains constructive, although price is now nearing important resistance areas that could slow or temporarily cap the advance. A continuation of the bullish structure depends on maintaining support and breaking through upper transition levels.
🔹 Transition Zones:
1.33330–1.33660 – Bullish Transition Zone.
This zone represents the next significant resistance band where sellers may attempt to regain control. A strong breakout above this region would signal renewed bullish momentum and open the pathway toward higher targets.
1.30390–1.30650 – Bullish Transition Zone.
This lower zone serves as a key support area that has previously attracted buyers during declines. As long as the pair remains above this zone, the underlying bullish sentiment stays structurally intact.
🔹 Dynamic Support/Resistance Levels:
Price: 1.32480
This level currently acts as an immediate overhead barrier that price needs to overcome for bullish continuation. A clean break above it would help solidify the upward trajectory.
Price: 1.30820
This level functions as an important dynamic support, helping preserve the current bullish structure. A drop below this area could trigger deeper pullbacks and weaken bullish sentiment.
🔹 Commentary:
GBP/USD continues to perform strongly, supported by multiple days of sustained bullish activity and improved market appetite. Price is approaching notable resistance, making the upcoming sessions crucial for confirming whether buyers can maintain control. Holding above dynamic support remains essential to keeping the trend intact. Traders should closely monitor reactions within the upper transition zone, as it will likely determine whether the current bullish momentum accelerates or pauses.
GOLD (XAU/USD)

🔹 Overall Sentiment:
Bullish – XAU/USD has maintained strong bullish sentiment for the past six days, with consistent upward momentum driving price into new short term highs. Buyers remain firmly in control, supported by rising structure and sustained demand across multiple sessions. The strength of this move suggests confidence in further upside, especially as price continues to stay well above key dynamic support levels. However, price is now approaching upper resistance areas where volatility and profit taking may temporarily increase.
🔹 Transition Zones:
3820–3895 – Bearish Transition Zone.
This lower transition zone acted as a major accumulation area where buyers previously stepped in aggressively. As long as gold remains above this zone, the broader bullish structure remains protected.
4061–4125 – Bullish Transition Zone.
This zone served as a mid range consolidation area before the current breakout. Retesting this region could offer strong support if the market experiences a pullback.
🔹 Dynamic Support/Resistance Levels:
Price: 3942
This level marks an important dynamic support area that helped establish the recent bullish leg. A break below it would weaken current momentum and open room for deeper corrections.
Price: 4139
This dynamic level acted as resistance prior to the breakout and now serves as an important support reference. Holding above it strengthens the case for continued bullish pressure toward higher targets.
🔹 Commentary:
Gold continues to push higher with momentum fully aligned in favor of the bulls, reflecting ongoing market confidence. The breakout above the upper transition zone confirms strong demand, with price currently trading at multi week highs. Traders should watch for short term consolidation as the market digests recent gains before attempting further upside. As long as gold stays above dynamic support, the bullish narrative remains firmly intact.
WTI (Crude Oil)

🔹 Overall Sentiment:
Bullish – WTI has shifted into bullish sentiment over the past day, supported by a decisive rebound from the lower transition zone. Buyers have begun regaining control after an extended period of weakness, marking a potential short term trend shift. Price structure is improving as candles push above reactive levels with stronger momentum. However, upside continuation will still depend on how price behaves when it approaches higher resistance areas.
🔹 Transition Zones:
61.25–62.85 – Bearish Transition Zone.
This upper transition zone represents a significant supply region where sellers have repeatedly pushed price lower. A clean breakout above this zone would confirm strong bullish continuation and shift the broader outlook upward.
56.35–58.10 – Bullish Transition Zone.
This lower transition zone held as a major accumulation area, providing the foundation for the current rebound. As long as WTI remains above this zone, bullish sentiment retains structural support.
🔹 Dynamic Support/Resistance Levels:
Price: 62.55
This level acts as a key dynamic resistance that price must overcome to confirm a stronger bullish breakout. Failure to break above it may lead to renewed selling pressure or consolidation beneath it.
Price: 57.44
This level is now serving as dynamic support, aligning with the recent bullish reversal. Holding above it suggests buyers are defending the new momentum shift effectively.
🔹 Commentary:
WTI is showing early signs of strength, with buyers stepping in and defending key lower levels convincingly. The market is attempting to transition from a prolonged bearish phase into a more balanced or potentially bullish structure. Watching how price reacts around the upper transition zone will be crucial for assessing the next major move. If momentum continues, WTI could challenge higher resistance levels in the coming sessions.
S&P 500
🔹 Overall Sentiment:
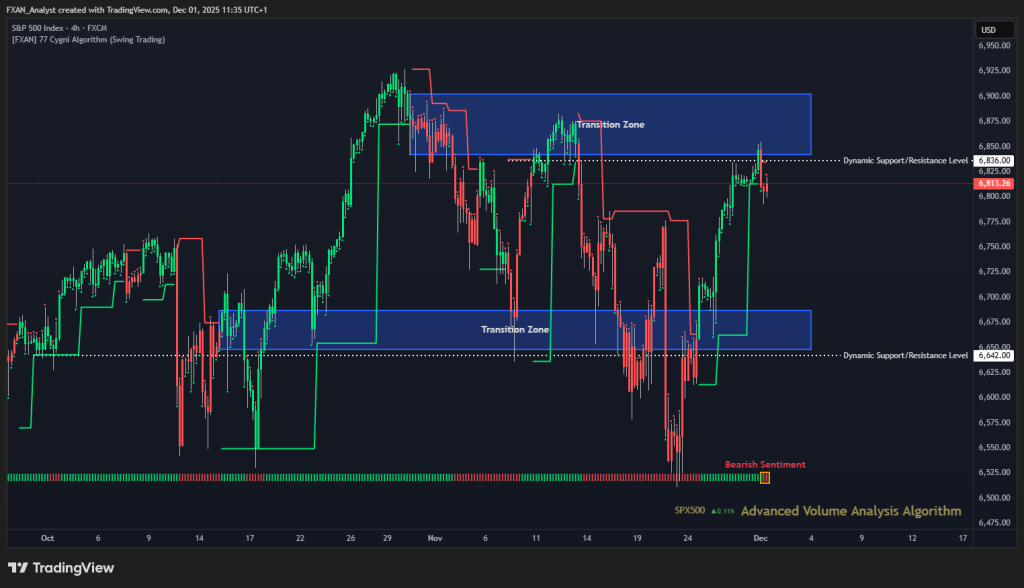
Bearish – The S&P 500 is showing bearish sentiment over the past day as price pulls back from the upper region of the chart. Sellers have stepped in near the recent highs, creating hesitation and weakening upside momentum. Despite this, the broader trend remains relatively elevated, suggesting that current bearish pressure may be corrective rather than a full reversal. The next sessions will determine whether this pullback deepens or if buyers regain control.
🔹 Transition Zones:
6648–6687 – Bullish Transition Zone.
This lower transition zone represents an important area where buyers previously stepped in to recover the recent drop. If price retraces into this zone again, it will act as the first key battleground between buyers and sellers.
6842–6902 – Bearish Transition Zone.
This upper transition zone marks a strong resistance region where the market recently rejected. Price struggled to maintain momentum above this range, signalling renewed selling pressure from the top of the structure.
🔹 Dynamic Support/Resistance Levels:
Price: 6642
This dynamic level acts as an important support threshold, and a break below it would likely amplify bearish sentiment. Holding above it, however, would help stabilize price and limit downside continuation.
Price: 6836
This level is currently functioning as a dynamic resistance, with price rejecting just beneath it. A clean break above would be required to invalidate short term bearish pressure and reestablish bullish strength.
🔹 Commentary:
The S&P 500 is experiencing short term weakness after reaching resistance levels, and sellers have used this opportunity to apply pressure. The reaction around the upper transition zone shows clear hesitation from buyers, increasing the likelihood of a deeper pullback. Monitoring how the market interacts with the lower transition zone and dynamic support will be crucial for anticipating the next move. For now, bearish sentiment dominates, but the broader structure still leaves room for a potential recovery if buyers defend key levels.
BTC/USD (Bitcoin)

🔹 Overall Sentiment:
Bearish –BTC/USD continues to exhibit strong bearish sentiment for nearly three weeks, with sellers maintaining clear control of the overall structure. The recent sharp rejection from above 93,000 reinforces the weakness, pushing price back toward lower support levels. Momentum remains skewed to the downside, and buyers have yet to show sustained strength. Until a meaningful recovery develops, bearish pressure is likely to dominate the short term outlook.
🔹 Transition Zones:
103,200 – 105,500 – Bearish Transition Zone.
This upper transition zone represents a major supply area where sellers previously overwhelmed buyers, resulting in strong downward swings. Any future retest of this zone would likely face heavy resistance unless market sentiment shifts significantly.
84,300 – 86,450 – Bullish Transition Zone.
This lower zone acts as a key demand region where buyers recently attempted to stabilize price. A decisive break below this area would open the door to deeper declines and intensify bearish momentum.
🔹 Dynamic Support/Resistance Levels:
Price: 107,450
This dynamic level stands as a critical long term resistance, firmly capping bullish attempts. As long as BTC remains below this threshold, upward movements are likely to be limited.
Price: 93,075
This level previously served as support but has now transitioned into resistance following the recent rejection. Price failing to reclaim this mark reinforces the ongoing bearish trend.
🔹 Commentary:
BTC remains under sustained selling pressure, and the inability to break higher levels highlights persistent weakness. The extreme bearish sentiment shown by the volume analysis indicator signals continued downside risk. If buyers cannot defend the lower transition zone, a fresh wave of selling could emerge. Overall, the market structure favors further declines unless BTC reclaims the mid-90,000s with conviction.