Get the latest Market Report for April 28, 2025, featuring key insights, analysis, and trading opportunities across major markets.

Market Report – 28th of April, 2025

EUR/USD
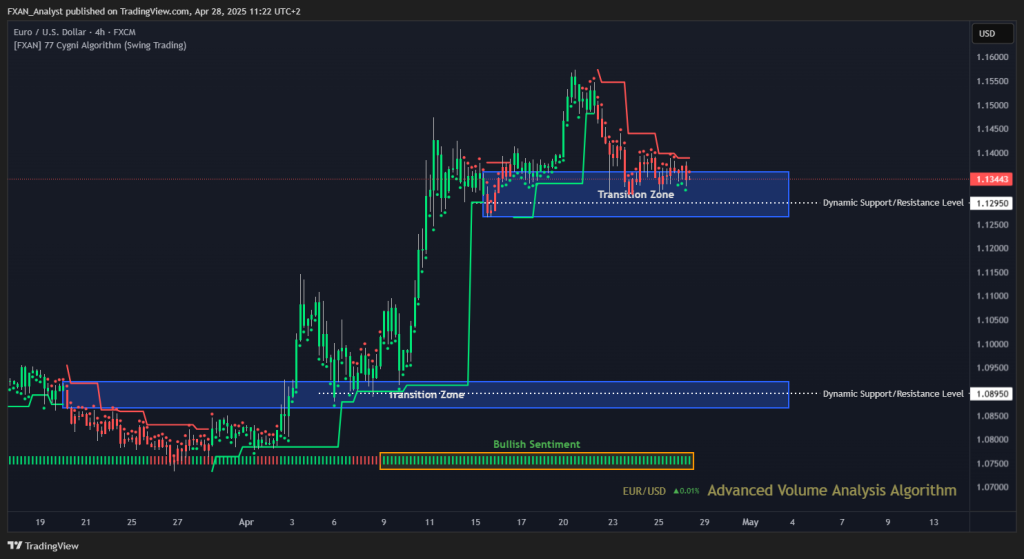
🔹 Overall Sentiment:
Bullish – EUR/USD is trading at 1.13443, maintaining bullish sentiment for almost two and a half weeks. Despite some recent signs of consolidation, the pair has held up well and remains above critical support zones. Buyers are showing resilience, with the price action consistently finding strength on dips, suggesting a continuation of the broader bullish narrative.
🔹 Transition Zones:
1.08650 – 1.09200 – Bearish Transition Zone.
This was the initial breakout area earlier this month and now serves as a strong foundational support zone. If broader market conditions trigger a correction, this area is expected to absorb selling pressure and could act as a platform for another leg higher.
1.12650 – 1.13600 – Bearish Transition Zone.
The price is currently fluctuating within this zone, marking it as an important battleground between bulls and bears. Sustained movement above this zone would confirm the continuation of the uptrend, while a rejection could signal a short-term pullback.
🔹 Dynamic Support/Resistance Levels:
Price: 1.08950
This level represents major structural support and is critical to preserving the long-term bullish structure of EUR/USD. As long as the market trades well above this level, the broader bias remains positive.
Price: 1.12950
Currently acting as an immediate support zone, this level forms the floor of the ongoing consolidation range. A daily close below this level could open the door for a deeper corrective phase toward lower supports.
🔹 Commentary:
EUR/USD remains firmly positioned within a bullish environment, but the pace of upward momentum has noticeably slowed as the price interacts with the upper transition zone. Bulls will need to defend the 1.12950 level strongly in the coming sessions to maintain the current structure and prevent a shift toward a neutral or bearish outlook. A decisive breakout above 1.13600 would likely clear the path for an acceleration toward the 1.1450–1.1500 region, attracting additional buying interest. Conversely, if the market fails to hold above 1.12950, it could spark a deeper retracement, possibly targeting the 1.12 handle.
GBP/USD
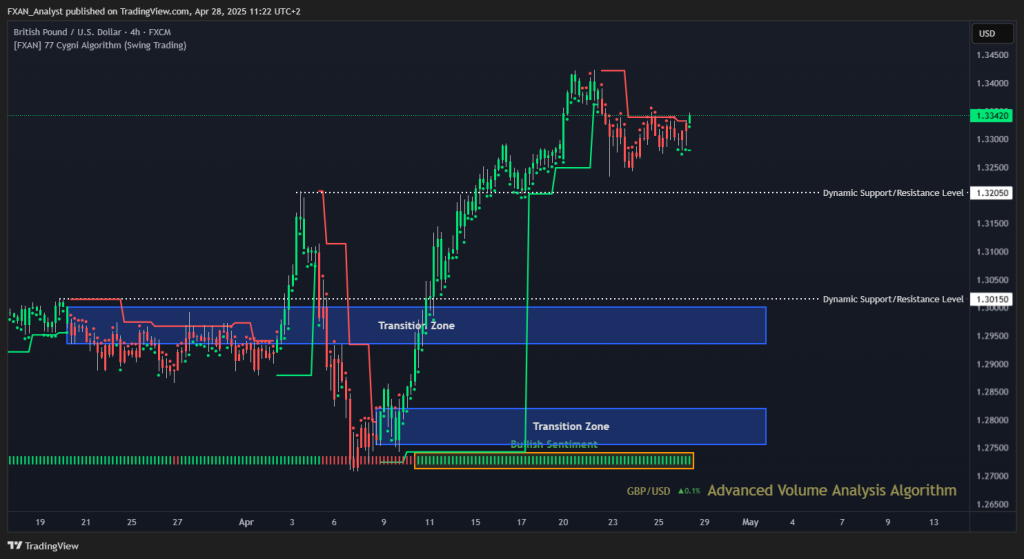
🔹 Overall Sentiment:
Bullish – GBP/USD is currently trading at 1.33420, maintaining a strong bullish momentum that has persisted for over two weeks and a half. Buyers continue to dominate the narrative, driving higher highs while defending against deeper pullbacks. The consistent bullish pressure indicates firm confidence among market participants, with dips being quickly bought back.
🔹 Transition Zones:
1.27550 – 1.28200 – Bullish Transition Zone.
This was a critical area where a significant breakout occurred earlier in the month. It now serves as a robust underlying support zone, meaning any future pullbacks into this range are likely to encounter strong buying interest.
1.29350 – 1.30000 – Bearish Transition Zone.
The pair successfully cleared this area during its latest bullish rally. This transition zone now acts as a secondary support, helping to sustain the bullish structure. Price retesting this area would likely be seen as a healthy correction rather than a bearish reversal.
🔹 Dynamic Support/Resistance Levels:
Price: 1.30150
This dynamic level remains a cornerstone for the bullish scenario. As long as GBP/USD holds above this mark, the overall bias stays positive and supportive of further gains.
Price: 1.32050
This is the current immediate support level underpinning the ongoing consolidation phase. Buyers must protect this level to avoid losing momentum and risking a steeper pullback toward lower zones.
🔹 Commentary:
GBP/USD continues to respect its bullish trend structure, although momentum has slightly slowed as the pair approaches the upper bounds of recent trading ranges. Holding above the 1.32050 level is essential to prevent a deeper corrective move. A strong breakout above the 1.3400–1.3450 region could reignite buying enthusiasm and push the pair toward new highs. However, traders should monitor any signs of weakness near current levels, as failure to hold above 1.32050 could trigger a move back toward the 1.30150 support zone, where bulls are likely to regroup.
GOLD (XAU/USD)
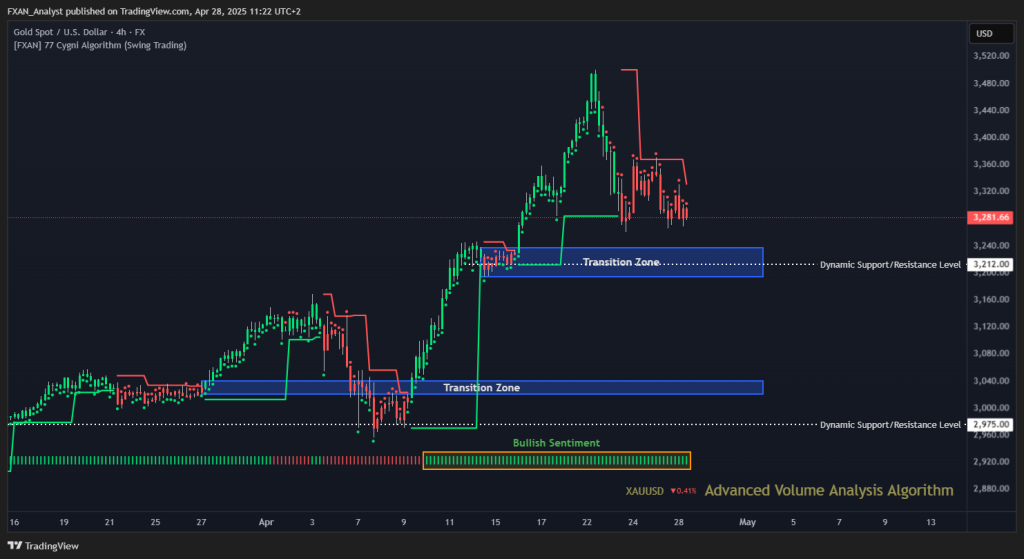
🔹 Overall Sentiment:
Bullish – Gold (XAU/USD) is currently trading at 3281, preserving its bullish bias that has persisted for over two and a half weeks. Despite some recent corrective pressure, the broader market sentiment remains tilted in favor of buyers. Momentum has cooled off slightly after an impressive rally, but the underlying strength remains notable, with dips consistently being defended by bullish participants.
🔹 Transition Zones:
3020 – 3040 – Bullish Transition Zone.
This transition zone provided the critical launchpad for the latest leg higher. It remains a fundamental area of structural support, and any deeper retracements into this zone would likely trigger renewed buying activity.
3194 – 3237 – Bearish Transition Zone.
Price recently interacted with this higher transition zone, and it is now serving as a battle ground between bulls and bears. Continued defense of this zone will be crucial to sustain the broader uptrend and keep the bullish momentum alive.
🔹 Dynamic Support/Resistance Levels:
Price: 2975
A decisive level that underpins the medium-term bullish outlook. As long as Gold holds above this dynamic support, the higher timeframe structure remains firmly bullish.
Price: 3212
This level is acting as an important near-term support after the recent surge. Bulls are currently attempting to establish a new higher base around this area, aiming to stabilize momentum for a potential continuation higher.
🔹 Commentary:
Although Gold has entered a consolidation phase after the strong breakout, the price action continues to favor the bulls. Defending the 3212 dynamic support level will be key over the coming sessions to maintain the upside bias. A clear breakout above 3300–3320 could reactivate bullish momentum and push XAU/USD toward new highs beyond 3400. On the downside, if sellers manage to break below 3212, it could lead to a corrective move toward the stronger support cluster around the 3020 – 3040 zone.
WTI (Crude Oil)
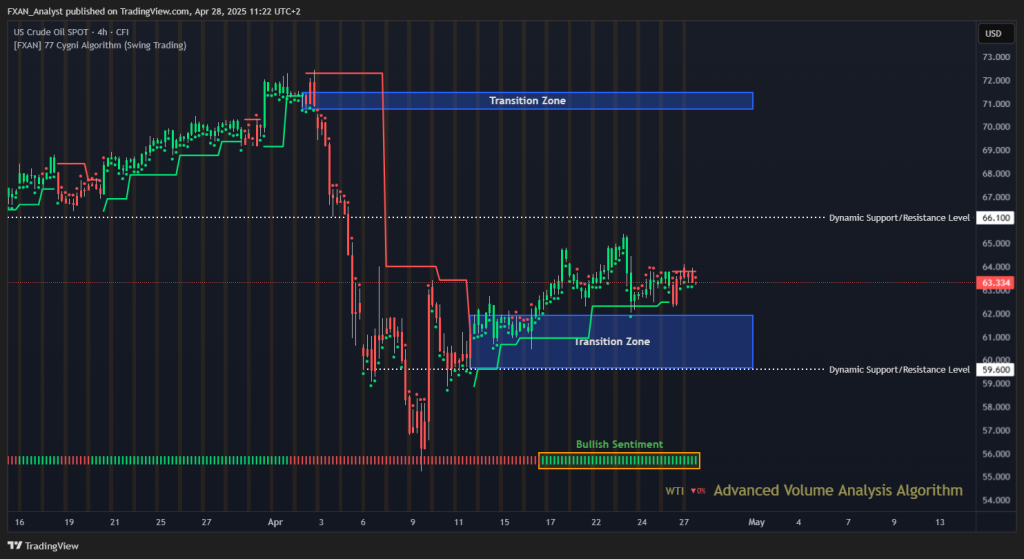
🔹 Overall Sentiment:
Bullish – WTI Crude Oil is currently trading at 63.334, maintaining its bullish tone for the past week and a half. Although momentum has slowed in recent sessions, the underlying sentiment remains supportive of higher prices. Price action continues to consolidate above key structural levels, signaling that bulls are still in control despite the absence of a strong breakout.
🔹 Transition Zones:
59.650 – 61.900 – Bullish Transition Zone.
This lower transition zone remains a crucial area of defense for the bulls. It acted as a strong base from which the latest rally emerged, and it continues to provide vital structural support on pullbacks.
70.750 – 71.450 – Bearish Transition Zone.
This higher transition zone represents a major resistance cluster. Should bullish momentum resume and the market pushes higher, this will be a significant area to watch for potential reactions or profit-taking.
🔹 Dynamic Support/Resistance Levels:
Price: 59.600
A critical dynamic support that is currently underpinning the bullish structure. As long as WTI remains above this level, the broader bullish bias remains intact.
Price: 66.100
This resistance level is the next major hurdle for bulls to overcome. A decisive breakout above it would likely confirm the next stage of upward expansion, targeting the higher transition zone.
🔹 Commentary:
WTI continues to trade within a tight consolidation range after a meaningful bounce from the 59.650 – 61.900 support zone. The longer price remains above 59.600, the greater the probability of an eventual breakout to the upside. A move through 66.100 could accelerate bullish momentum significantly, opening the path toward the 70.750 – 71.450 target zone. On the other hand, failure to hold recent gains could invite a retest of the lower support cluster. At this stage, patience is key, but the prevailing structure still favors bulls over bears.
S&P 500
🔹 Overall Sentiment:
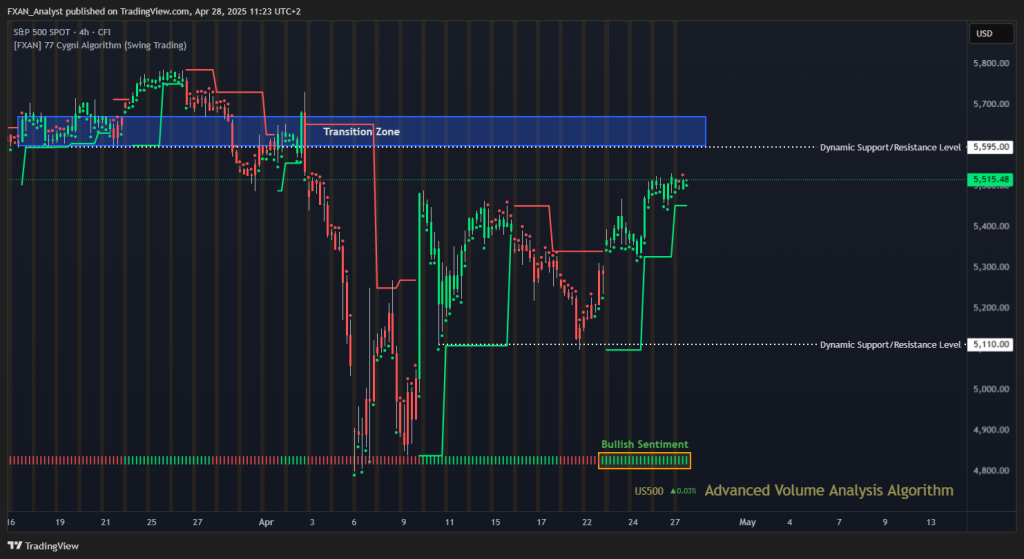
Bearish – The S&P 500 is currently trading at 5,515, maintaining a bullish sentiment that has been building consistently over the past week. Recent price action shows resilience as the index steadily climbs higher, indicating that buyers are regaining control. Momentum has been gradually strengthening, with a series of higher lows suggesting an ongoing bullish structure.
🔹 Transition Zones:
5598 – 5669 – Bullish Transition Zone.
This upper transition zone is a key focus area where selling pressure may begin to emerge. It marks a significant region where previous rallies encountered resistance, making it a likely battle zone between bulls and bears if price continues to advance.
🔹 Dynamic Support/Resistance Levels:
Price: 5110
The 5,110 level remains an essential dynamic support, forming the foundation of the current bullish recovery. As long as price holds above this support, the upward bias remains intact, providing buyers with a structural safety net.
Price: 5595
Positioned just below the upper transition zone, 5,595 acts as a near-term resistance that could challenge the next leg higher. A clear breakout above this level would reinforce the bullish trend and open the pathway toward testing the higher transition zone.
🔹 Commentary:
The S&P 500 continues to demonstrate strength as it consolidates just beneath the critical 5,595 resistance level. A sustained move above this barrier would likely trigger increased bullish momentum, potentially propelling the index into the 5,598 – 5,669 transition zone. Conversely, any rejection from these levels could lead to a modest pullback, but support around 5,110 should offer strong protection.
BTC/USD (Bitcoin)
🔹 Overall Sentiment:
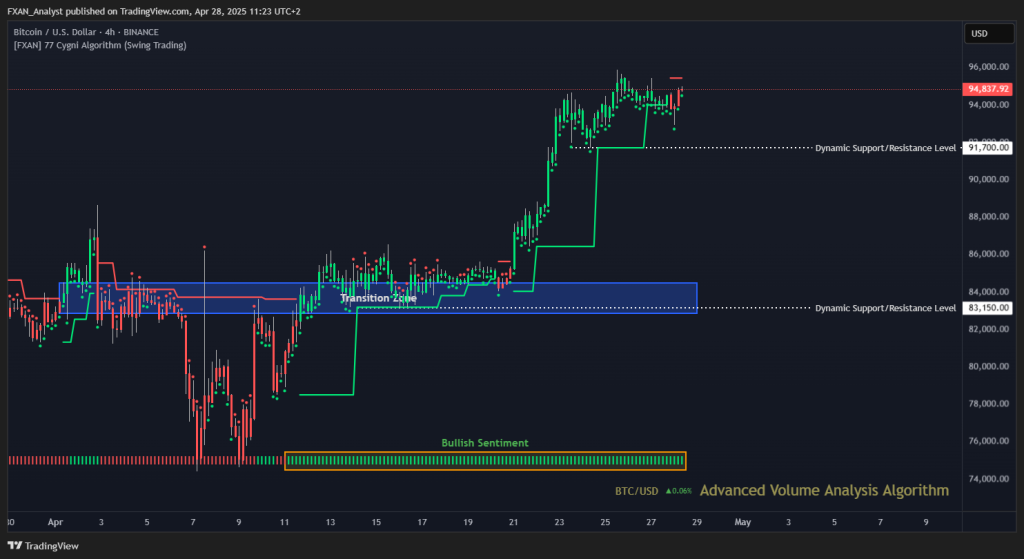
Bullish – Bitcoin continues its impressive bullish run, now trading at 94,837. The bullish sentiment has remained dominant for the past two and a half weeks, with buyers steadily maintaining pressure and controlling the trend. The sustained higher highs and higher lows structure clearly signals that the bulls remain firmly in command of the market direction.
🔹 Transition Zones:
82,850 – 84,450 – Bullish Transition Zone.
This transition zone marks a strong foundational support area, where previous consolidations and breakouts took place. It remains a critical region for any potential pullbacks, offering an important base for buyers to defend.
🔹 Dynamic Support/Resistance Levels:
Price: 83150
The 83,150 level acts as a pivotal support, reinforcing the bullish bias. Price holding firmly above this area strengthens the argument for continued upward movement, providing a reliable anchor point for bullish strategies.
Price: 91700
Previously a resistance hurdle, 91,700 has now been surpassed, confirming the strong bullish momentum. Bitcoin is currently consolidating above this dynamic level, signaling a healthy continuation pattern rather than a reversal.
🔹 Commentary:
Bitcoin’s rally shows no signs of exhaustion, as it continues to push higher with firm bullish momentum. After a clean break above 91,700, the price has been stabilizing near recent highs, indicating a potential launchpad for another upward move. As long as Bitcoin remains above the 91,700 dynamic support, the bias strongly favors further gains. Any dips towards 83,150 are likely to be viewed as buying opportunities by market participants.