Get the latest Market Report for November 7, 2025, featuring key insights, analysis, and trading opportunities across major markets.
Market Report – 7th of November, 2025
EUR/USD

🔹 Overall Sentiment:
Bullish – EUR/USD has exhibited bullish sentiment over the past two days, signaling early signs of recovery after a prolonged bearish phase. Buyers have begun to regain confidence, pushing the price higher from recent lows. The short-term structure now reflects growing momentum to the upside as the pair attempts to establish a higher low. Sustained buying pressure could pave the way for a potential continuation toward key resistance zones.
🔹 Transition Zones:
1.16580 – 1.16840 – Bullish Transition Zone.
The first transition zone between 1.16580 – 1.16840 remains a significant hurdle that may determine whether the current bullish momentum can extend further. If price manages to close above this area, it would confirm a stronger shift in sentiment toward buyers.
1.17300 – 1.17770 – Bearish Transition Zone.
The second transition zone between 1.17300 – 1.17770 represents a broader resistance region that has repeatedly rejected price advances in previous sessions. A break above this zone could signal a deeper bullish correction within the medium-term trend.
🔹 Dynamic Support/Resistance Levels:
Price: 1.17170
Level 1 at 1.17170 acts as a near-term resistance level where minor pullbacks may occur before continuation. Clearing this level would solidify the bullish bias and encourage further long positions.
Price: 1.17800
Level 2 at 1.17800 stands as a more substantial resistance and the next key upside target. A confirmed close above this point could mark a potential shift in the broader market direction.
🔹 Commentary:
EUR/USD’s recent rebound highlights renewed optimism among buyers following an extended downtrend. The current bullish sentiment suggests that the market may be entering a corrective phase. Traders are likely watching the 1.1650–1.1700 region closely for validation of the trend continuation. If momentum holds, the pair could move toward testing the 1.1750 level in the coming days, though resistance remains firm overhead.
GBP/USD

🔹 Overall Sentiment:
Bullish – GBP/USD has shown bullish sentiment over the past two days, signaling a potential recovery after an extended bearish phase. Buyers have stepped in near the 1.30 level, driving a short-term reversal supported by renewed market optimism. The pair’s momentum has strengthened slightly, though overall structure still favors caution. Sustained buying pressure above current levels will be essential for confirming a broader trend shift.
🔹 Transition Zones:
1.36200 – 1.37250 – Bearish Transition Zone.
The first transition zone between 1.36200 – 1.37250 represents a critical resistance range where previous rallies have faced rejection. A move into this area could test the strength of the ongoing bullish momentum and determine whether a longer-term reversal is feasible.
1.34150 – 1.34660 – Bullish Transition Zone.
The second transition zone between 1.34150 – 1.34660 serves as an immediate technical barrier to further upside. Reclaiming this range could open the path for continuation toward the higher resistance zone around 1.37.
🔹 Dynamic Support/Resistance Levels:
Price: 1.34450
Level 1 at 1.34450 remains the nearest resistance area and will be key in validating the current bullish sentiment. A clear close above it could invite additional buyers and mark a stronger shift in short-term trend dynamics.
Price: 1.36730
Level 2 at 1.36730 stands as a major structural resistance aligned with the upper transition zone. Overcoming this level would signal renewed market confidence and potentially confirm the end of the broader downtrend.
🔹 Commentary:
GBP/USD’s recent rebound reflects improving sentiment following a deep correction, with bullish traders attempting to build a base around the 1.30 handle. However, the pair still faces heavy resistance ahead, suggesting the recovery remains in its early stages. Short-term momentum supports continued upside attempts as long as price remains above 1.3050. A successful push beyond 1.3450 would strengthen the bullish case, while failure to hold current gains could lead to renewed selling pressure.
GOLD (XAU/USD)

🔹 Overall Sentiment:
Bullish – XAU/USD has maintained bullish sentiment over the past two days, with price stabilizing above the $3,950 level and gradually regaining upward momentum. Buyers appear to be defending key support zones, hinting at growing confidence after a period of consolidation. While upward strength remains moderate, sentiment suggests an attempt to reestablish bullish control. A continued push above the $4,000 mark could confirm a shift toward renewed buying interest.
🔹 Transition Zones:
3820 – 3898 – Bearish Transition Zone.
The first transition zone between 3,820 – 3,898 has served as a strong base of accumulation, supporting multiple rebounds in recent sessions. Holding above this area will be critical to maintaining the ongoing bullish bias.
4167 – 4342 – Bearish Transition Zone.
The second transition zone between 4,167 – 4,342 represents a key resistance region where previous uptrends have lost momentum. A breakout above this range would reinforce the overall bullish narrative and could invite further upward acceleration.
🔹 Dynamic Support/Resistance Levels:
Price: 3898
Level 1 at 3,898 acts as a dynamic support level that continues to attract buyers during retracements. Sustaining this level will likely preserve the short-term bullish structure and prevent deeper pullbacks.
Price: 4382
Level 2 at 4,382 marks an important resistance zone, aligned with the upper boundary of the previous rally. A clear break above this level could open the path toward higher targets, confirming the strength of the current trend.
🔹 Commentary:
Gold’s recent performance shows improved sentiment as it consolidates gains near the $4,000 level. The consistent buying pressure near support suggests that the market is building a foundation for another potential leg higher. If momentum persists, traders may look for a test of the $4,150–$4,200 range. However, failure to hold above $3,900 could invite short-term profit-taking and stall the current recovery attempt.
WTI (Crude Oil)

🔹 Overall Sentiment:
Bearish – WTI crude oil has maintained a bearish sentiment for the past five days as sellers continue to dominate near the $60 region. The market has struggled to hold above short-term resistance levels, signaling persistent downward pressure. Despite intermittent rebounds, overall momentum remains weak and tilted to the downside. Traders are showing caution as price action consolidates near a key psychological threshold.
🔹 Transition Zones:
64.35 – 65.65 – Bearish Transition Zone.
The first transition zone between 64.35 – 65.65 has acted as a strong rejection area in previous rallies, capping upside attempts. Any move toward this region would likely face increased selling activity unless sentiment shifts decisively.
60.60 – 61.85 – Bullish Transition Zone.
The second transition zone between 60.60 – 61.85 has seen mixed behavior, functioning as both support and resistance in recent sessions. A sustained break above 61.85 could be an early sign of bullish stabilization, but for now, it remains a pivot area of indecision.
🔹 Dynamic Support/Resistance Levels:
Price: 61.65
Level 1 at 61.65 continues to serve as immediate resistance, restricting upward movement over the past few days. A clear breakout above this level could mark a short-term reversal attempt but remains unlikely under current sentiment conditions.
Price: 62.90
Level 2 at 62.90 represents a stronger resistance zone where selling pressure has consistently resurfaced. A close above this point would be required to invalidate the ongoing bearish bias.
🔹 Commentary:
WTI’s price action reflects continued uncertainty, with sellers keeping firm control below $62. Market sentiment remains cautious as traders await fresh catalysts to define the next major move. Short-term rebounds are likely to face strong headwinds from the 61.50–62.00 area. Unless demand improves or fundamental drivers shift, the path of least resistance for WTI remains tilted to the downside.
S&P 500
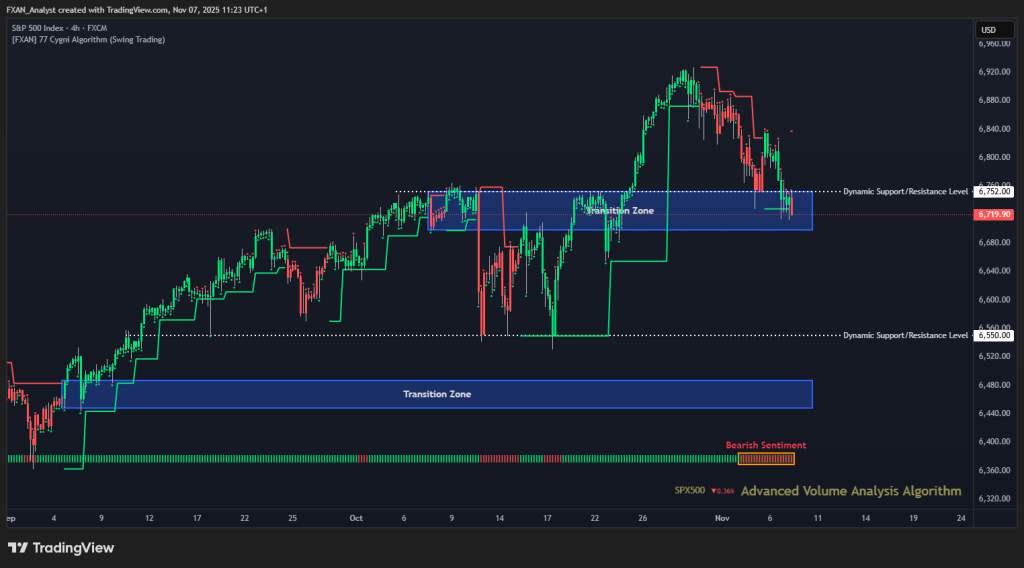
🔹 Overall Sentiment:
Bearish – The S&P 500 has maintained bearish sentiment over the past four days as downward pressure intensified near key resistance zones. Sellers have regained short-term control, with price slipping below recent highs and consolidating near support. The overall momentum has weakened, suggesting caution among buyers. Market sentiment remains fragile as the index tests critical technical levels.
🔹 Transition Zones:
6448 – 6487 – Bullish Transition Zone.
The first transition zone between 6,448 – 6,487 has served as a stable support area throughout previous corrections. A revisit to this zone could provide a foundation for potential rebounds if sentiment improves.
6698 – 6752 – Bearish Transition Zone.
The second transition zone between 6,698 – 6,752 now acts as a primary resistance zone, capping recent recovery attempts. A decisive close above this level would be necessary to signal renewed buying strength and halt the ongoing decline.
🔹 Dynamic Support/Resistance Levels:
Price: 6550
Level 1 at 6,550 stands as key structural support where buying interest may resurface. A breakdown below this level could accelerate bearish momentum toward lower ranges.
Price: 6752
Level 2 at 6,752 represents immediate resistance and aligns with the upper boundary of the transition zone. Price rejection from this level reinforces the prevailing bearish bias in the short term.
🔹 Commentary:
The S&P 500’s current trajectory reflects persistent hesitation among investors, with momentum favoring sellers. The index’s inability to hold gains above 6,750 has contributed to the recent correction. However, buyers are showing signs of defending the lower boundary near 6,700, creating a potential area of consolidation. If sentiment fails to recover, further downside pressure toward 6,550 remains a likely scenario in the near term.
BTC/USD (Bitcoin)
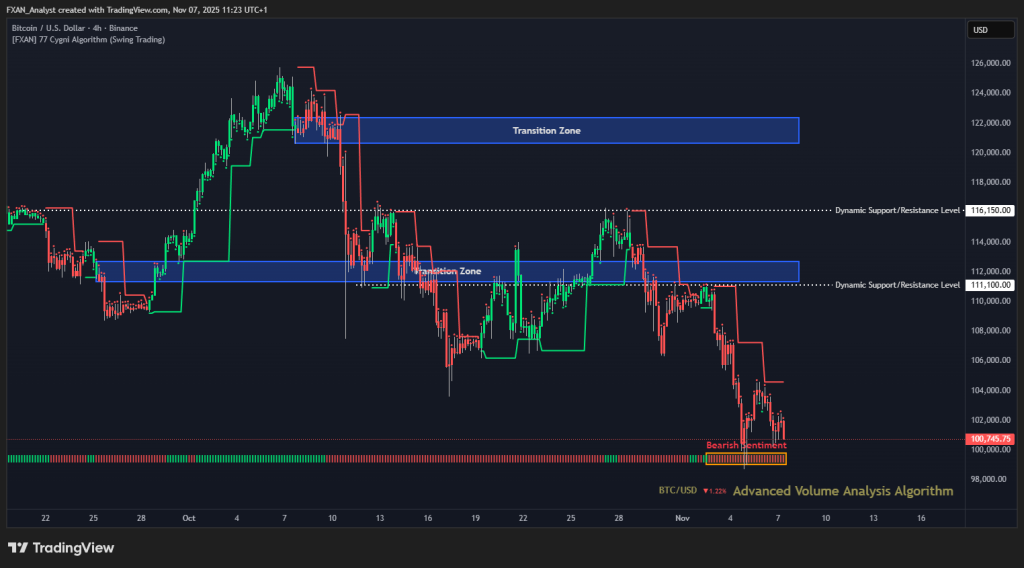
🔹 Overall Sentiment:
Bearish – BTC/USD has sustained a bearish sentiment over the past week, with consistent selling pressure driving the pair toward the $100,000 zone. The market has shown limited attempts at recovery, reflecting weak bullish conviction amid prevailing downside momentum. Bears remain firmly in control as price continues to trend below key resistance areas. Short-term sentiment remains cautious as traders await a potential base formation.
🔹 Transition Zones:
111,350 – 112,700 – Bearish Transition Zone.
The first transition zone between 111,350 – 112,700 has acted as a major rejection point for multiple rally attempts. This area continues to cap any upside movement, highlighting the market’s struggle to regain bullish traction.
120,650 – 122,350 – Bearish Transition Zone.
The second transition zone between 120,650 – 122,350 remains an important long-term resistance region. Price would need a strong breakout and sustained momentum above this level to indicate a meaningful trend reversal.
🔹 Dynamic Support/Resistance Levels:
Price: 116,150
Level 1 at 116,150 serves as a key overhead resistance, reinforcing the current bearish structure. A decisive break above this level could help neutralize short-term selling pressure.
Price: 111,100
Level 2 at 111,100 marks the nearest resistance area, where failed breakout attempts have led to renewed declines. This level continues to play a pivotal role in defining short-term directional bias.
🔹 Commentary:
Bitcoin’s prolonged bearish sentiment highlights a lack of market confidence following recent declines. Selling pressure remains persistent, with each rally quickly met by resistance near 111,000. A close below the $100,000 mark could trigger another wave of downside momentum. However, if buying strength emerges near current levels, a short-term consolidation phase may develop before the next major move.